
- Articles
- Insights
Trading the midterms: What to watch before and after the vote
October 20, 2026With the U.S. midterms quickly approaching, now’s not the time to be numb to political uncertainty that’s been the source of much of the market volatility in recent years. If anything, the election could have significant implications for financial markets, influencing everything from stock prices and sector leadership to bond yields and fiscal policy moves.
Election results, though, don’t come with a ready-made trading strategy. The market impact depends on what could change in Congress, how much investors have already anticipated and what else is happening in the economy. Historical patterns, however, offer useful context into how markets might move, but traders still need to assess opportunities and risks as they emerge.
What history tells us
Stocks have historically performed well around U.S. midterm elections. According to FactSet data published by Edward Jones, across the 14 midterms from 1970 through 2022, the S&P 500 gained an average of 4.5% in the month before election day, with positive total returns in approximately 79% of the time. Over the following six months, it gained an average of 15.5% and finished higher after every election in that sample.
Canadian stocks have shown a similar pattern over a shorter period. Across the 10 U.S. midterms from 1986 through 2022, the S&P/TSX Composite gained an average of approximately 11% in the six months following election day, with positive total returns in every instance.
The shorter-term record is less consistent. In the month after election day, the S&P 500 gained an average of 1.7% and was positive only about 71% of the time. The TSX gained an average of 1.4%, with positive returns in 80% of periods. In other words, stocks have sometimes fallen in the first month after midterms before finishing higher over the full six-month period.
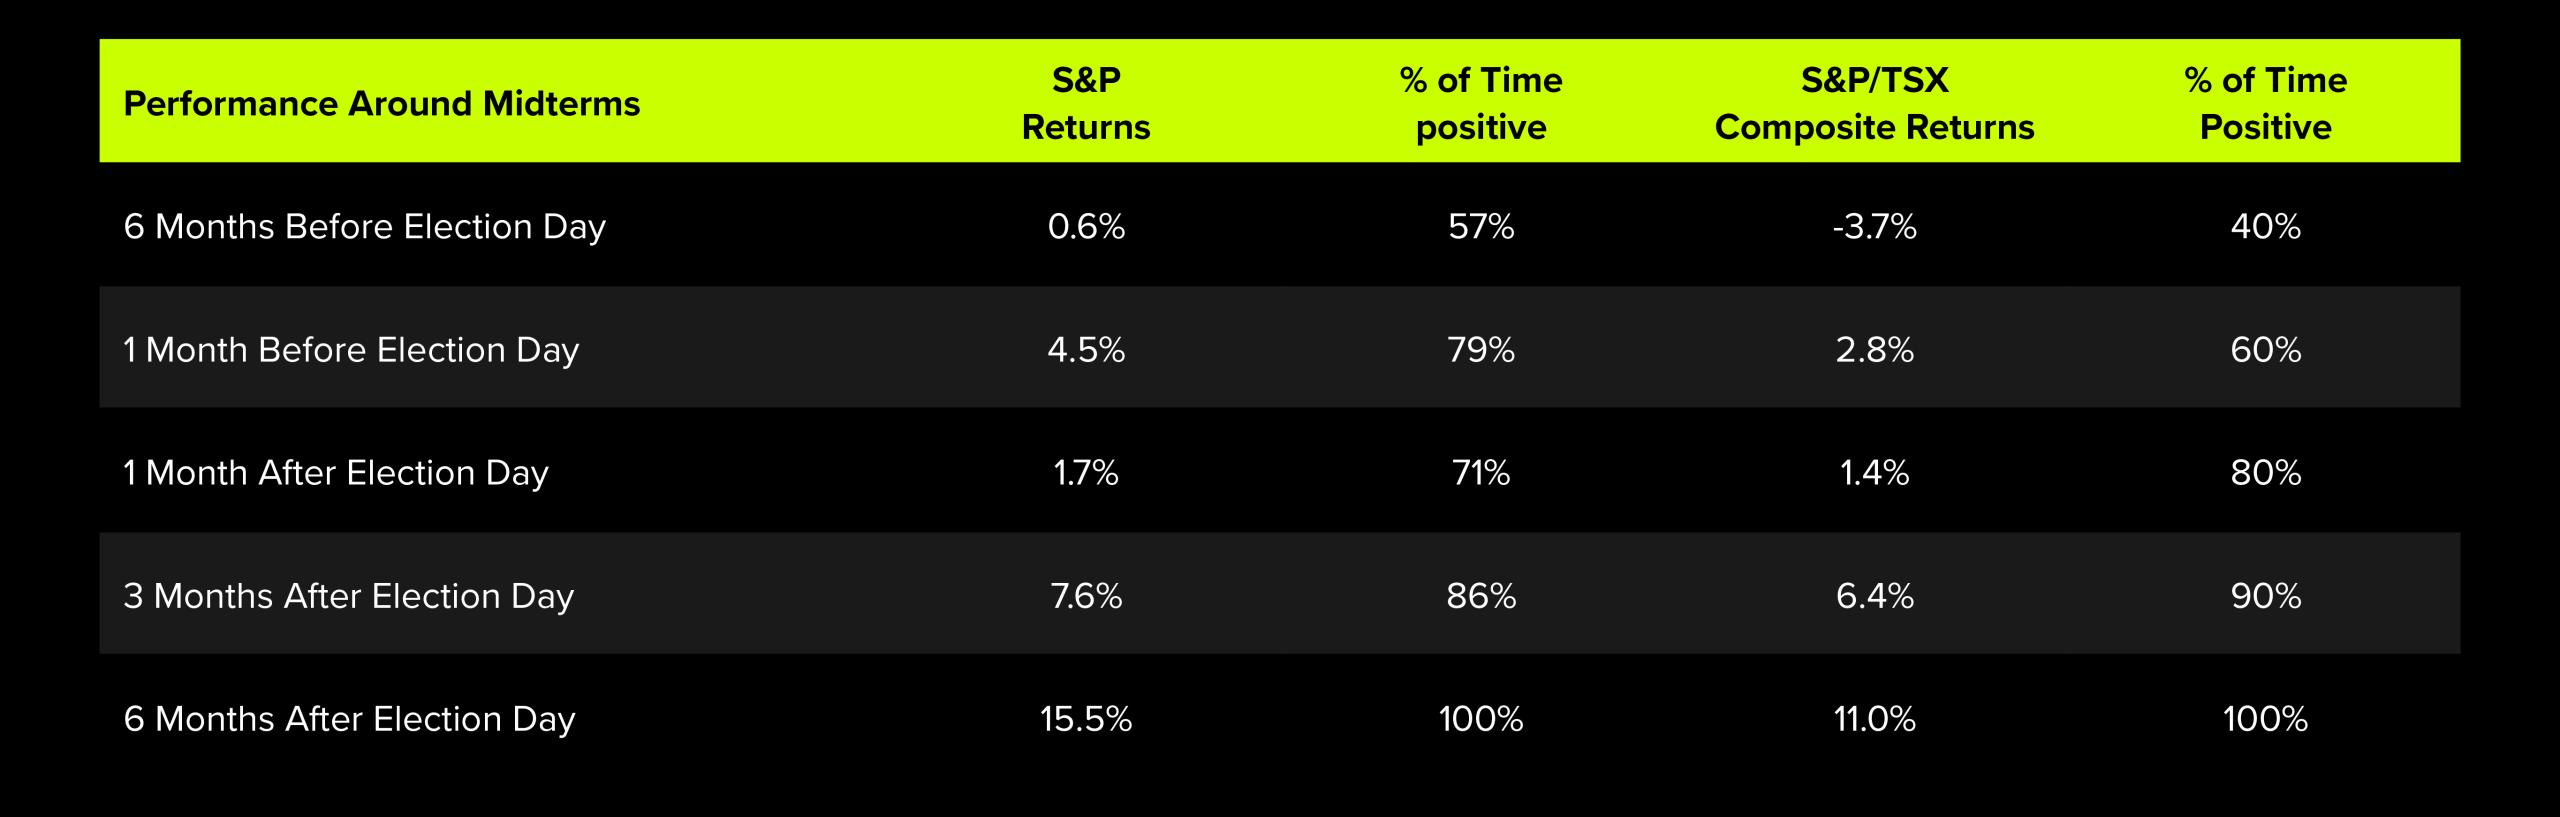
These figures also don’t prove that the elections caused the gains, of course. Midterm years have coincided with other important turning points, including the aftermath of the technology bust in 2002 and Federal Reserve tightening in 2018 and 2022. Earnings, inflation and interest rates can reinforce or overwhelm an election-related move.
As for volatility, expectations for market swings have tended to ease around the vote. A December 2024 analysis by a St. Louis Fed economist, using election data since 1988, found that the VIX, a measure of expected U.S. stock market volatility, was, on average, 7.3% lower three days after midterm elections than it had been two days before. One possible explanation is that knowing the result removes a source of uncertainty about the policy outlook, even if investors don’t favour the outcome. That said, the historical pattern does not establish that volatility will decline after the 2026 election.
What could change in Washington
The key political question is whether Republicans retain control of both chambers of Congress or Democrats win one or both. A change in control could make it harder for the administration to pass new legislation and create more contentious negotiations over government funding and borrowing.
The makeup of Congress and the president’s party also impact market performance. In an analysis covering April 1945 through September 2024, CFRA Research found that under a Republican president (which, of course, will not change this November), the S&P 500’s average annual gain was 12.9% when Republicans controlled both chambers, 7.3% when different parties controlled the House and Senate and 4.9% when Democrats controlled both. All three arrangements produced positive average gains, with the strongest performance under Republican control of both chambers and the weakest when a Republican president faces a Democratic Congress.
The Market Prefers a Unified Government or a Split Congress
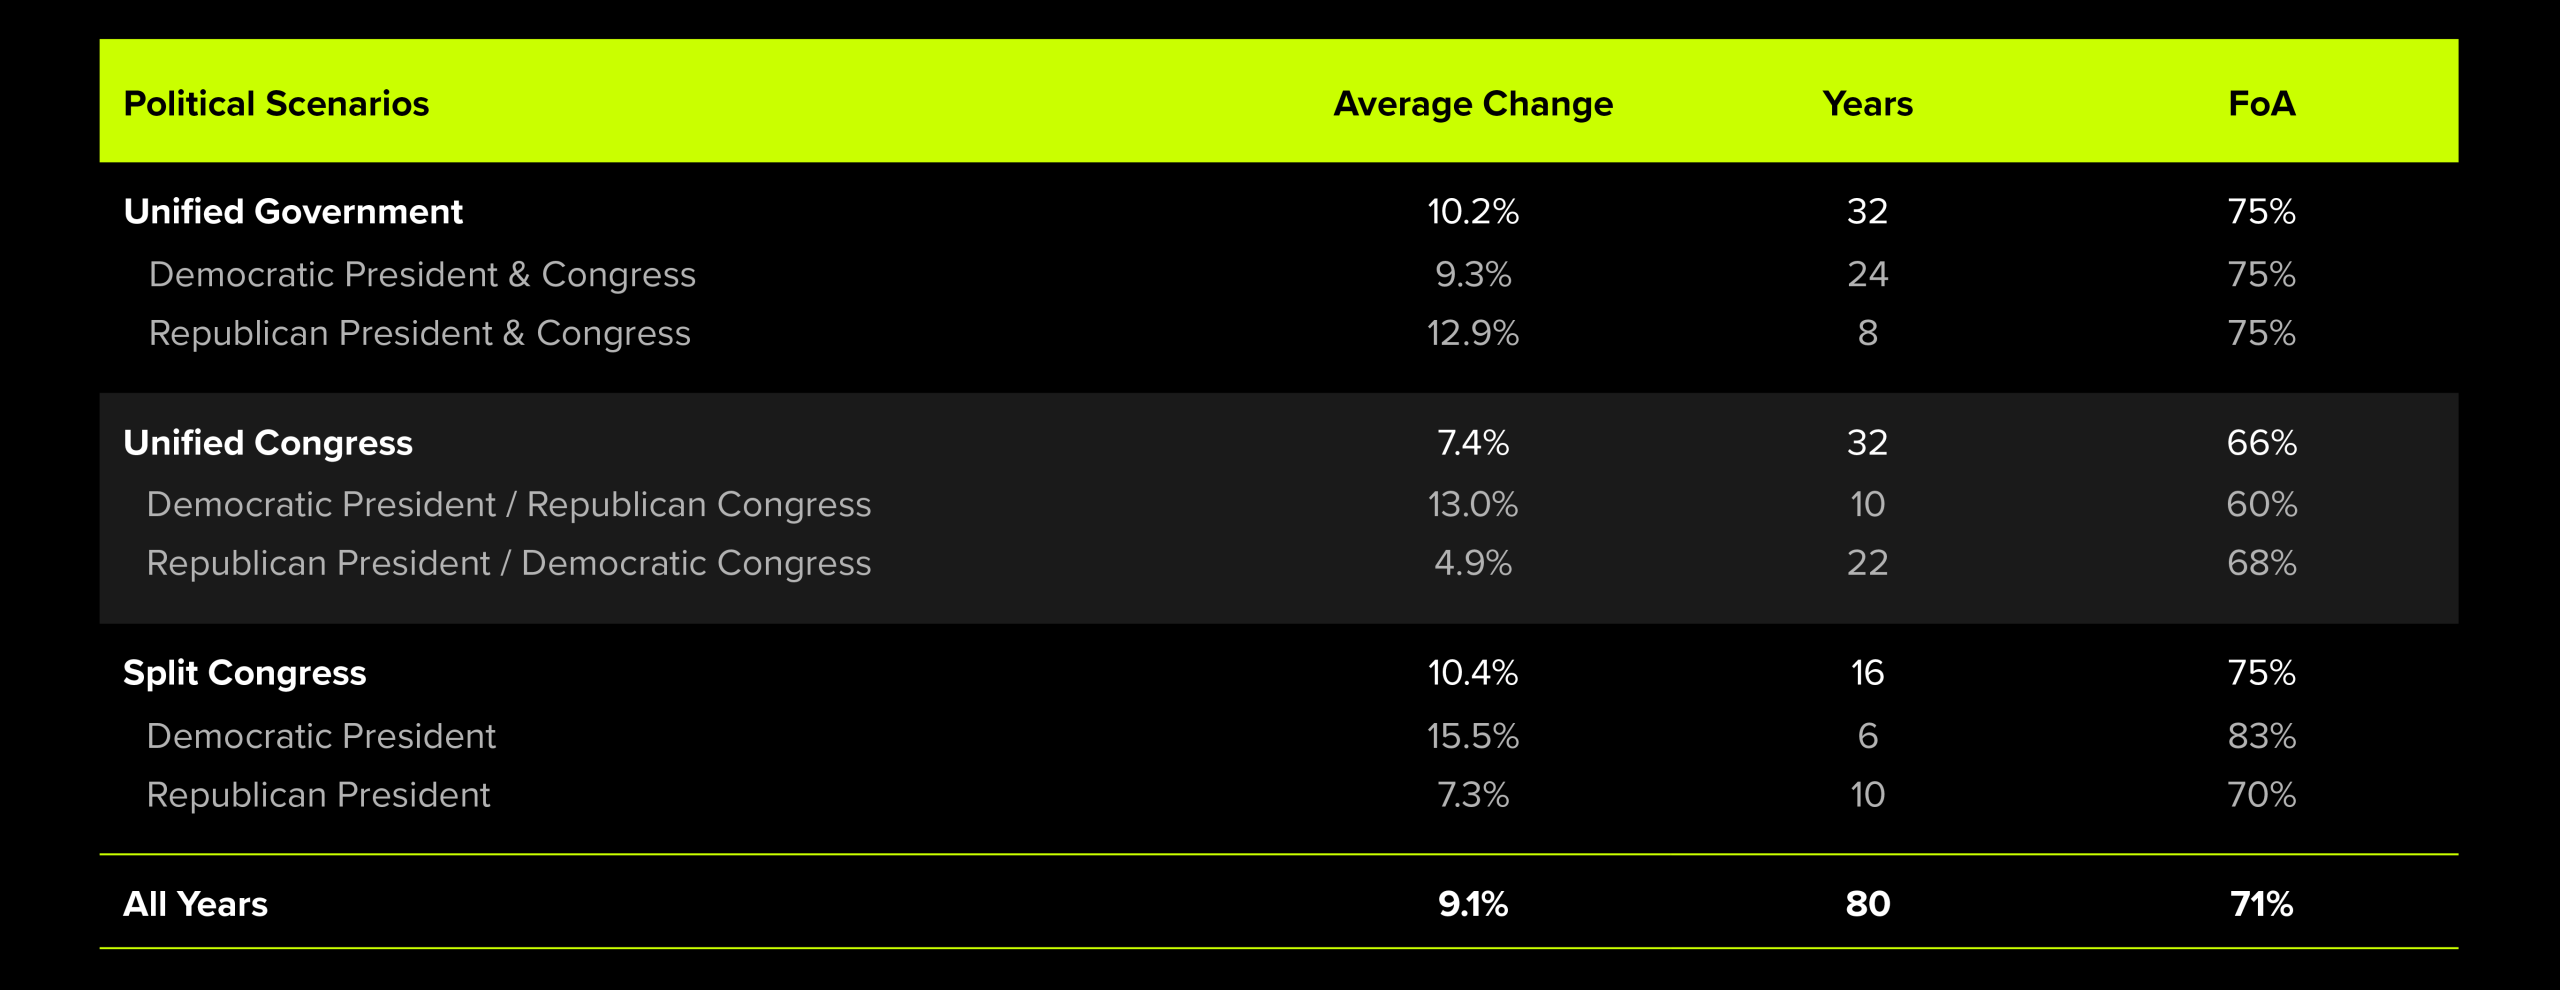
Those averages provide historical context, but they do not establish that a particular political arrangement causes stronger or weaker stock market performance. Economic conditions, monetary policy, earnings and other factors can influence returns during each period. However, understanding what each outcome could change about policy is more useful for assessing a potential trade.
For instance, expectations for larger government deficits and increased Treasury borrowing can put upward pressure on bond yields. A more constrained legislative agenda could reduce expectations for additional fiscal expansion, although bipartisan spending agreements would remain possible.
Beyond the bond market, higher Treasury yields can weigh on equity valuations, particularly when they rise without a corresponding improvement in the economic outlook. Traders watching stock indexes should therefore pay attention to the bond market’s response alongside the election headlines.
If Democrats win control of the House or Senate, disagreements with the White House could make it harder to agree on government funding or raise the debt ceiling. Those disputes could trigger market moves in the months after the election, giving traders another catalyst to watch.
A change in Congress would not eliminate the White House’s ability to pursue policy through executive action. Trade and parts of the regulatory agenda could remain uncertain, including for Canadian companies exposed to U.S. policy. So, even if lawmakers struggle to pass new legislation, White House policy announcements could still trigger market moves.
Watch for surprises
Markets respond to changing expectations, so correctly predicting which party will win may not be enough to anticipate the market’s reaction. An outcome investors largely expect could produce a modest response; an unexpected result could prompt a sharper reassessment of the policy outlook.
For traders, that means considering several scenarios before the vote: How might different election results affect your view on where stocks, bonds or commodities could head? What would make you reconsider that view? And what’s your exit plan if the market moves against you?
Understanding the trade
Election-related price swings can create trading opportunities in either direction during the trading day. Before entering a trade, consider your position size, entry price and exit plan. Stop-loss orders can help you put that plan into action by triggering a sale if prices move against you, although the execution price may differ from your chosen stop level.
For traders considering daily leveraged or inverse ETFs, the investment objective and holding period matters too. These funds generally target a specified multiple or inverse of their benchmark’s daily performance, before fees and expenses. Because of daily compounding, returns over longer periods can differ substantially from that multiple applied to the benchmark’s cumulative return. A historical six-month index gain therefore cannot simply be multiplied by two or three to estimate a leveraged ETF’s performance over the same period.
For active traders, the U.S. midterms are certainly a major event to watch not just on November 3, but beyond as the political implications of the vote become clearer. Watch how markets respond today and, in the months, ahead, keep earnings and economic developments in view, and be ready to adjust your position as new information emerges.
Related Articles